文章目录
- 一、环境准备
- 1、硬件准备(虚拟机)
- 2、关闭防火墙,selinux
- 3、所有主机安装docker
- 二、配置Prometheus
- 1、docker启动Prometheus
- 三、添加监控节点
- 1、docker启动node-exporter
- 四、Prometheus配置node-exporter
- 1、修改prometheus.yml配置文件
- 五、配置Alertmanager
- 1、docker启动Alertmanager
- 六、Alertmanager配置邮件告警
- 七、配置Alertmanager告警规则
- 1、创建报警规则文件`node-up.rules`
- 2、然后修改 `prometheus.yml` 配置文件,添加 rules 规则文件。
- 八、触发报警发送Email
- 1、停止服务测试
- 九、Alertmanager配置自定义邮件模板
- 1、创建一个模板文件
一、环境准备
1、硬件准备(虚拟机)
| 主机名 | IP地址 |
|---|---|
| server | 192.168.112.40 |
| node-exporter | 192.168.112.50 |
2、关闭防火墙,selinux
firewalld:
 systemctl stop firewalld	#关闭
 systemctl disable firewalld		#开机不自启
 systemctl status firewalld		#查看状态
selinux:
 sed -i 's/enforcing/disabled/' /etc/selinux/config
 setenforce 0
3、所有主机安装docker
yum install wget.x86_64 -y
rm -rf /etc/yum.repos.d/*
wget -O /etc/yum.repos.d/Centos-7.repo http://mirrors.aliyun.com/repo/Centos-7.repo
wget -O /etc/yum.repos.d/epel-7.repo http://mirrors.aliyun.com/repo/epel-7.repo
wget -O /etc/yum.repos.d/docker-ce.repo https://mirrors.aliyun.com/docker-ce/linux/centos/docker-ce.repo
yum install docker-ce -y
二、配置Prometheus
1、docker启动Prometheus
docker run本地没有镜像直接从Docker Hub上拉取镜像,-p参数将主机的9090端口映射到容器内的9090端口,没指定Prometheus版本就会自动拉取最新版本
server主机
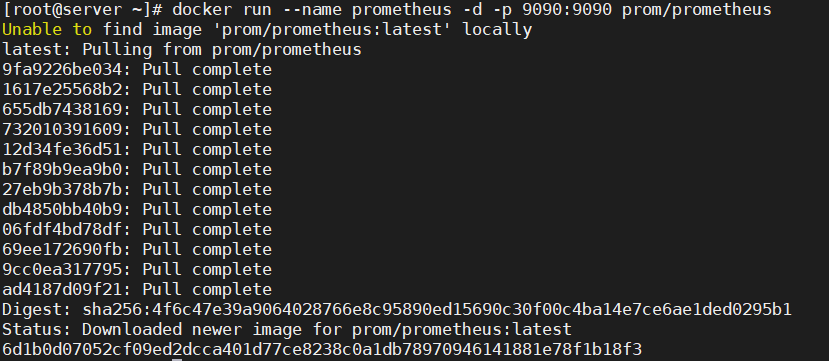
docker run --name prometheus -d -p 9090:9090 prom/prometheus
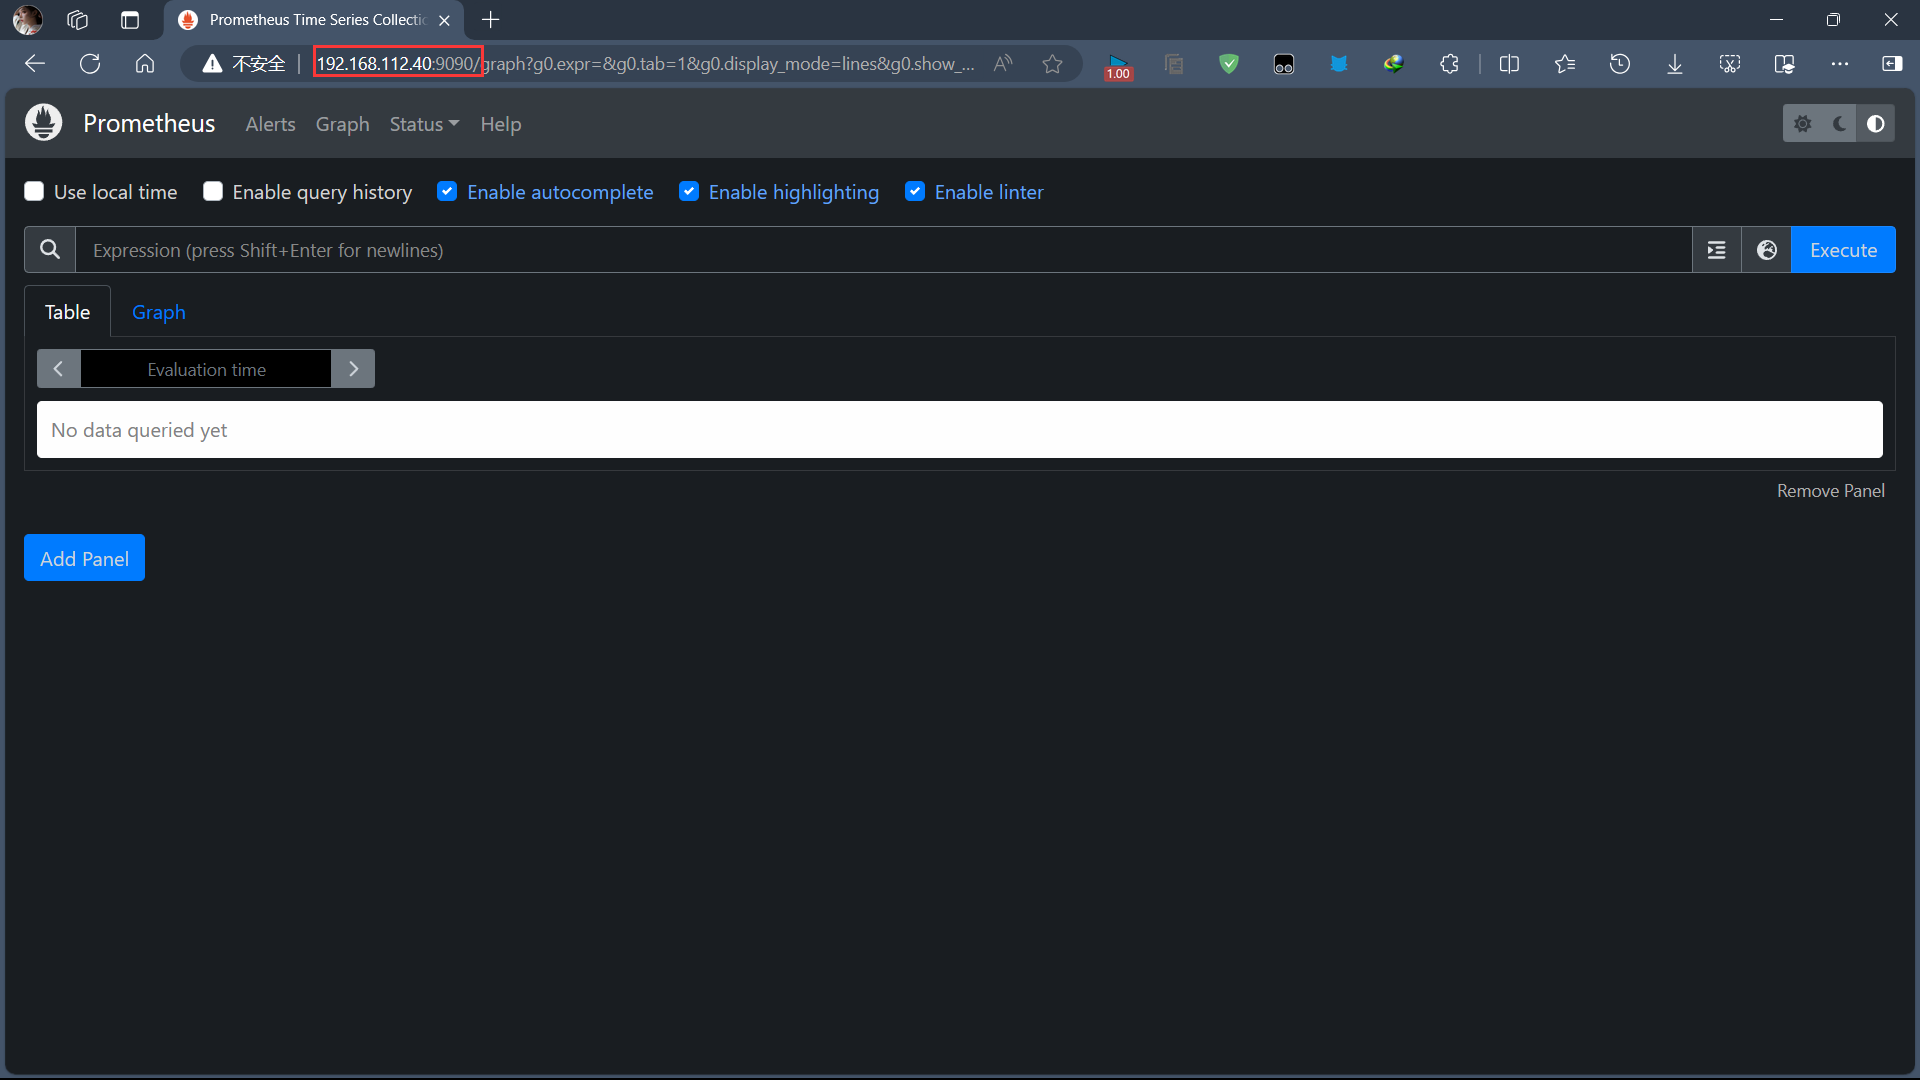
Prometheus的默认端口是9090。浏览器访问192.168.112.40:9090即可看到Prometheus默认的UI界面
Prometheus默认配置文件 prometheus.yml 在容器内路径为 /etc/prometheus/prometheus.yml。
[root@server ~]# docker exec -it prometheus /bin/sh
/prometheus $ cat /etc/prometheus/prometheus.yml
# my global config
global:
  scrape_interval: 15s # Set the scrape interval to every 15 seconds. Default is every 1 minute.
  evaluation_interval: 15s # Evaluate rules every 15 seconds. The default is every 1 minute.
  # scrape_timeout is set to the global default (10s).

# Alertmanager configuration
alerting:
  alertmanagers:
    - static_configs:
        - targets:
          # - alertmanager:9093

# Load rules once and periodically evaluate them according to the global 'evaluation_interval'.
rule_files:
  # - "first_rules.yml"
  # - "second_rules.yml"

# A scrape configuration containing exactly one endpoint to scrape:
# Here it's Prometheus itself.
scrape_configs:
  # The job name is added as a label `job=<job_name>` to any timeseries scraped from this config.
  - job_name: "prometheus"

    # metrics_path defaults to '/metrics'
    # scheme defaults to 'http'.

    static_configs:
      - targets: ["localhost:9090"]
#配置文件解释:
scrape_interval:每次数据采集的时间间隔,默认为1分钟
scrape_timeout:采集请求超时时间,默认为10秒
evaluation_interval:执行rules的频率,默认为1分钟
scrape_configs:主要用于配置被采集数据节点操作,每一个采集配置主要由以下几个参数
job_name:全局唯一名称
scrape_interval:默认等于global内设置的参数,设置后可以覆盖global中的值
scrape_timeout:默认等于global内设置的参数
metrics_path:从targets获取meitric的HTTP资源路径,默认是/metrics
honor_labels:Prometheus如何处理标签之间的冲突。若设置为True,则通过保留变迁来解
决冲突;若设置为false,则通过重命名;
scheme:用于请求的协议方式,默认是http
params:数据采集访问时HTTP URL设定的参数
relabel_configs:采集数据重置标签配置
metric_relabel_configs:重置标签配置
sample_limit:对每个被已知样本数量的每次采集进行限制,如果超过限制,该数据将被视为失败。默认值为0,表示无限制
三、添加监控节点
在被监控主机:192.168.112.50(node-exporter)上操作
1、docker启动node-exporter
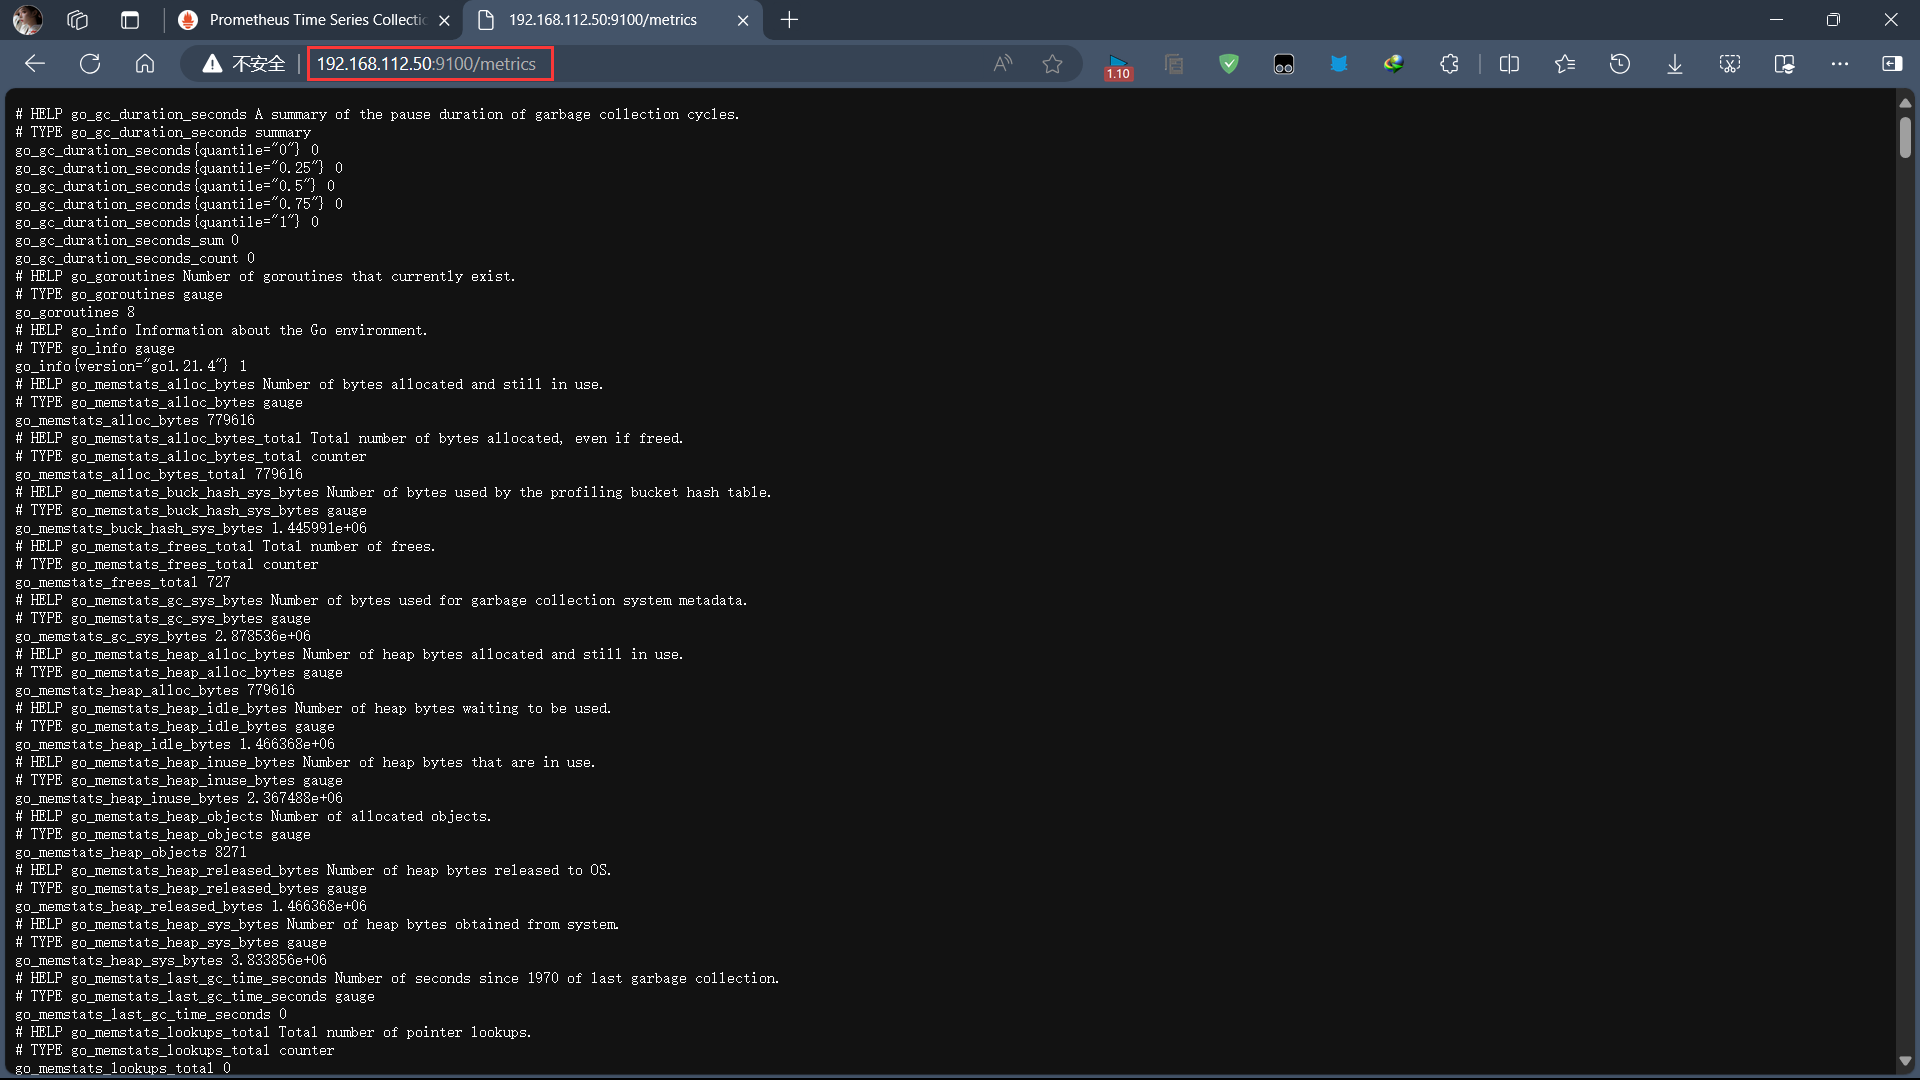
docker run --name node-exporter -d -p 9100:9100 prom/node-exporter
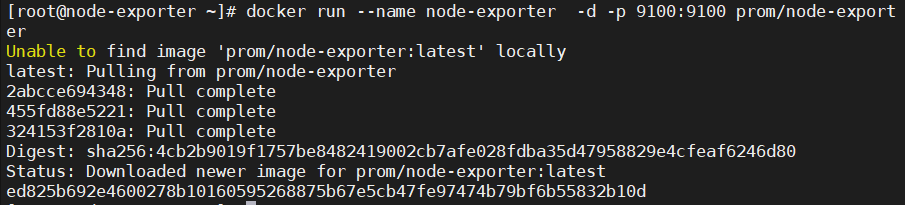
node-exporter默认端口是9100,浏览器访问192.168.112.50:9100/metrics可以看到Prometheus可提供的监控项列表
四、Prometheus配置node-exporter
1、修改prometheus.yml配置文件
将 node-exporter 信息配置到 Prometheus 中,来让 Prometheus 定期获取 exporter 采集的信息
在监控主机:192.168.112.40(server)上操作
[root@server ~]# mkdir -p /root/prometheus
[root@server ~]# cd /root/prometheus/
[root@server prometheus]# vim prometheus.yml
global:
  scrape_interval:     15s
  evaluation_interval: 15s
  # scrape_timeout is set to the global default (10s).
# Alertmanager configuration
alerting:
  alertmanagers:
  - static_configs:
    - targets:
      # - alertmanager:9093
# Load rules once and periodically evaluate them according to the global 'evaluation_interval'.
rule_files:
  # - "first_rules.yml"
  # - "second_rules.yml"

scrape_configs:
  - job_name: prometheus
    static_configs:
    - targets: ['192.168.112.40:9090']
      labels:
        instance: centos7

  - job_name: node-exporter
    static_configs:
    - targets: ['192.168.112.50:9100']
      labels:
        instance: centos7
配置完毕,需要将新的配置文件覆盖容器内配置文件,并重启 Prometheus 来使配置生效。
docker run -d --name prometheus -p 9090:9090 -v /root/prometheus/prometheus.yml:/etc/prometheus/prometheus.yml prom/prometheus
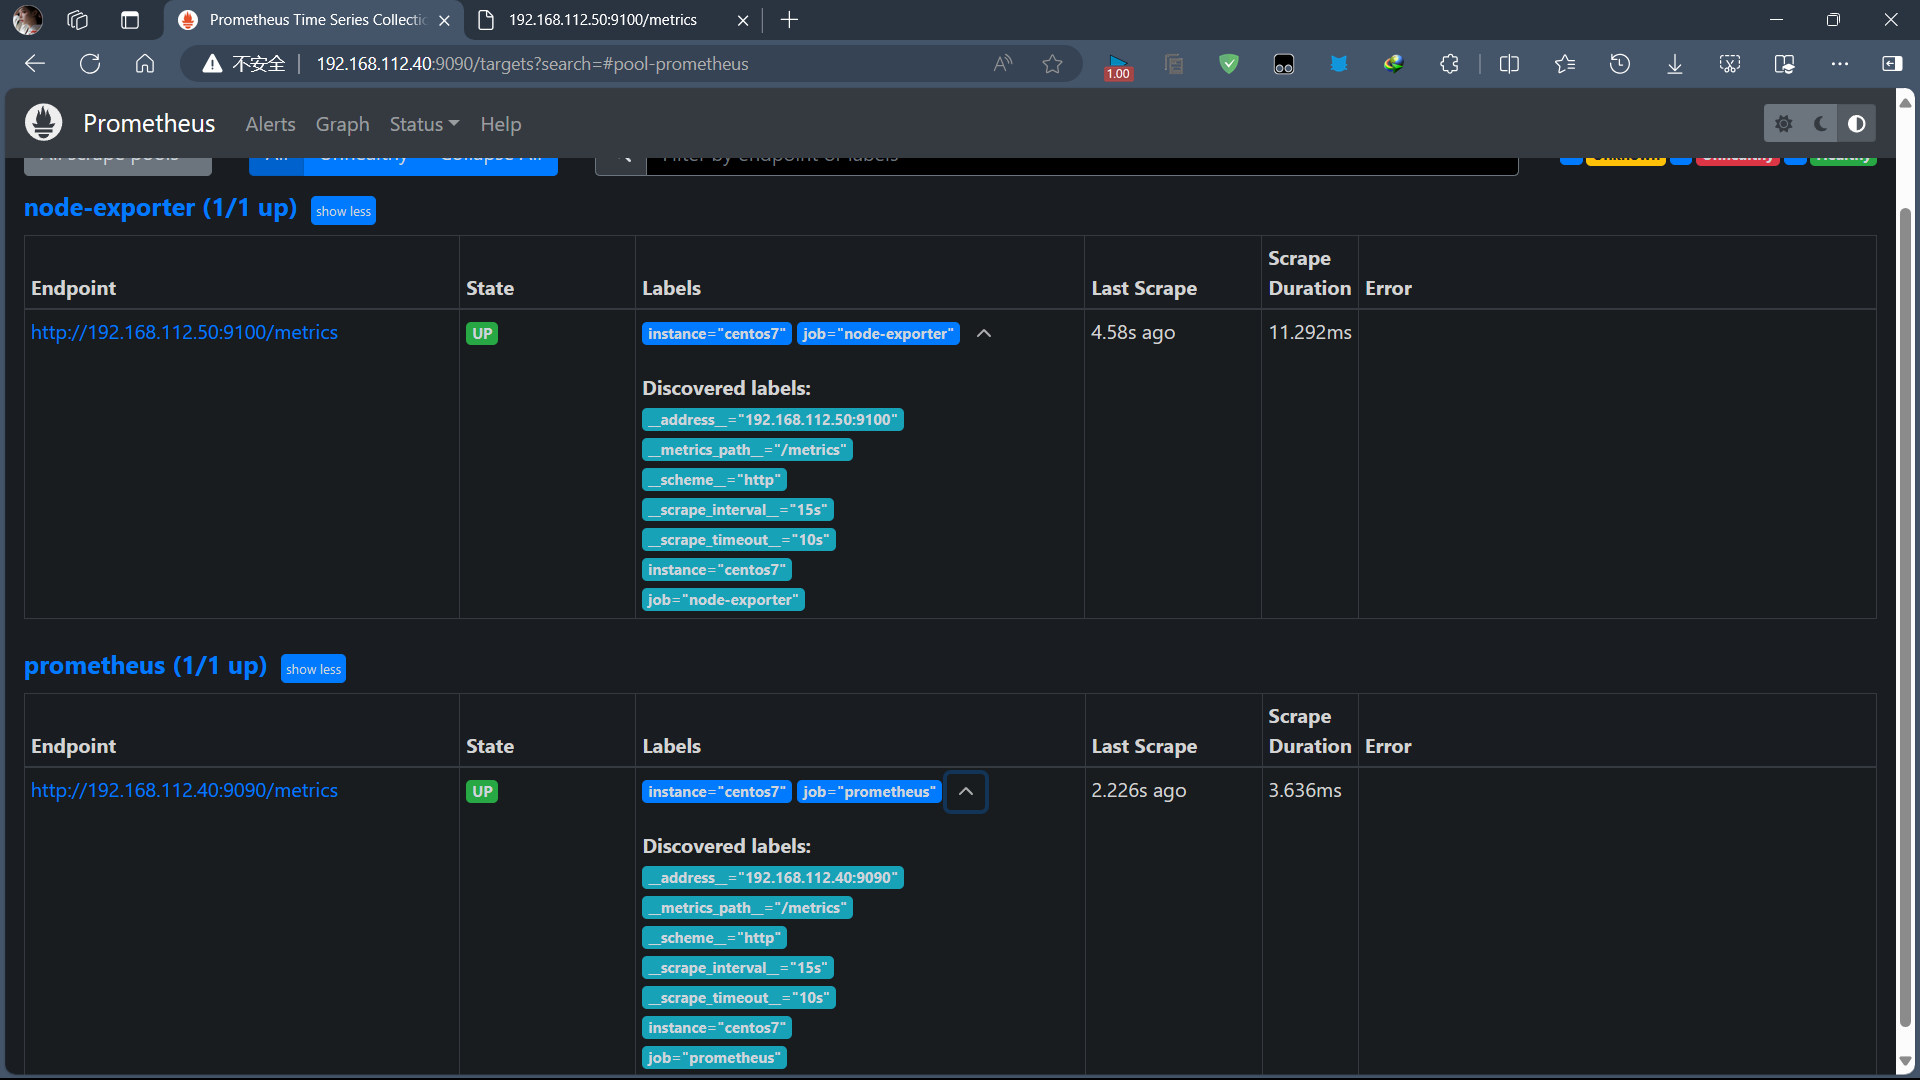
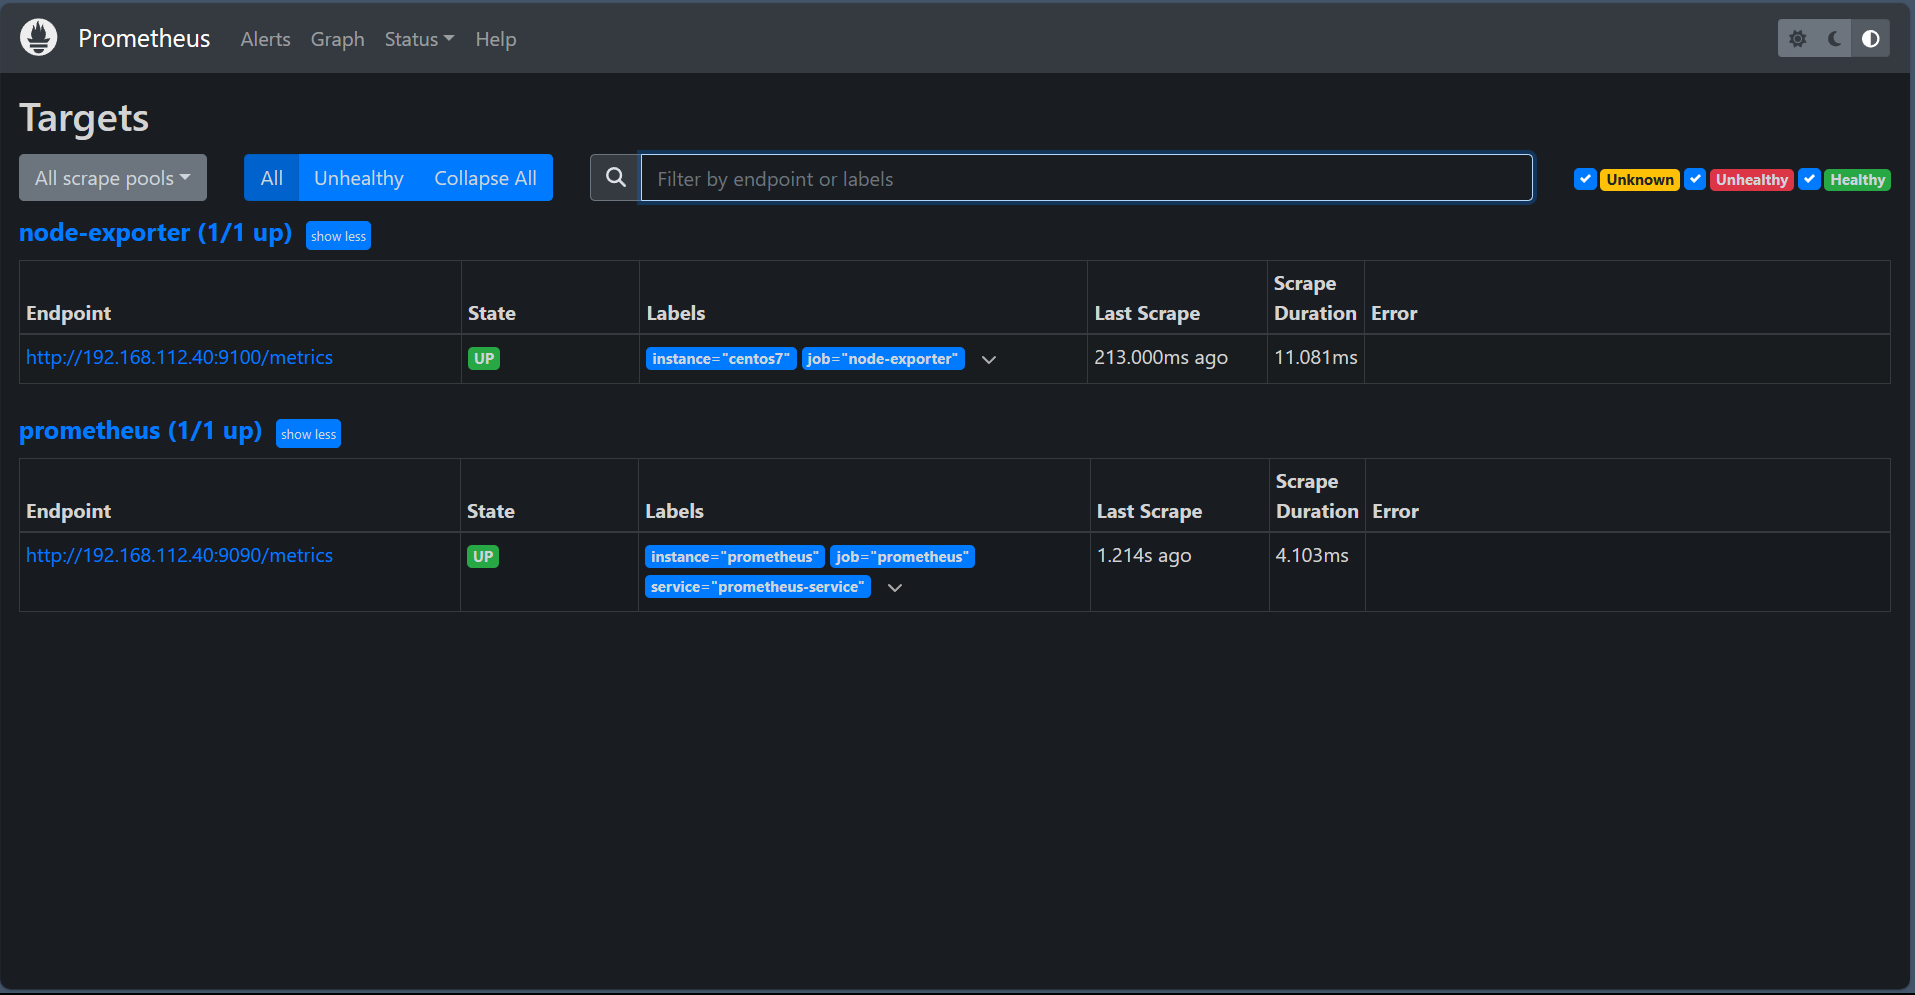
这里通过挂载的方式将外部配置文件覆盖容器内配置,重启 prometheus 服务,浏览器访问 192.168.112.40:9090 可以看到新增加的 target,并且是 healthy状态。
默认使用的是static_configs静态配置方式,这样就导致了每次配置都需要重启Prometheus服务。Prometheus提供了多种服务发现方式
-
azure_sd_configs
-
consul_sd_configs
-
dns_sd_configs
-
ec2_sd_configs
-
openstack_sd_configs
-
file_sd_configs
-
kubernetes_sd_configs
-
marathon_sd_configs
-
nerve_sd_configs
-
serverset_sd_configs
-
triton_sd_configs
这里采用file_sd_configs 方式,将 targets 以 Json 或 Yaml 方式写入特定文件中,那么只要文件发生变化,Prometheus 就会自动加载。
[
    {
        "targets": [
            "192.168.112.50:9100"
        ],
        "labels": {
            "instance": "centos7",
        }
    }
]
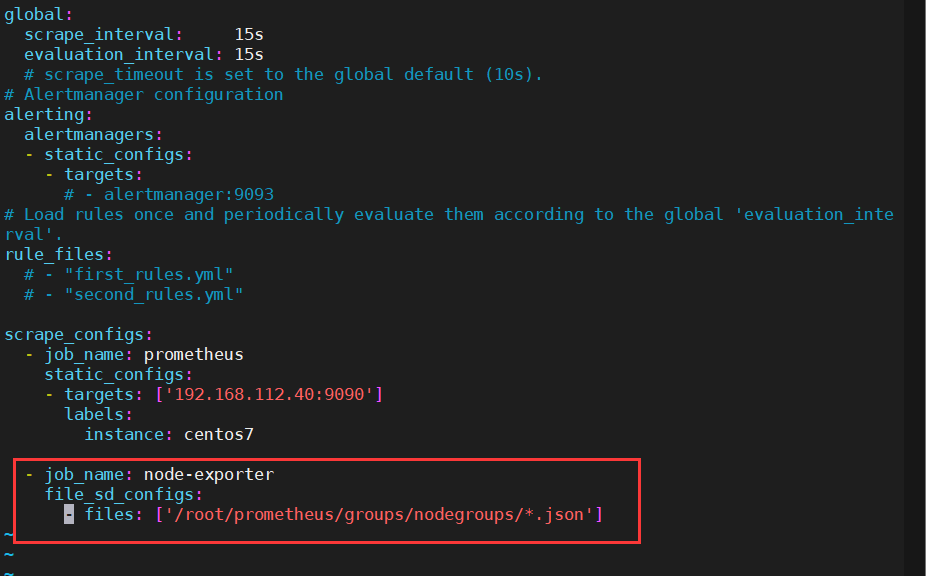
新建一个 node.json 文件,将 prometheus.yml 中 job_name: 'node-exporter' 下的信息以 Json 方式配置到该文件中,然后修改 prometheus.yml 加载方式为 file_sd_configs,配置修改如下:
  - job_name: node-exporter
    file_sd_configs:
      - files: ['/root/prometheus/groups/nodegroups/*.json']
这里我们指定加载容器内目录配置文件,那么需要将本地 node.json 文件挂载到容器内指定目录上,修改 Prometheus 启动命令如下:
docker run -d --name prometheus -p 9090:9090 -v /root/prometheus/prometheus.yml:/etc/prometheus/prometheus.yml -v /root/prometheus/groups/:/usr/local/prometheus/groups/ prom/prometheus
启动成功,以后在添加或修改 Node 相关的 exproter,就可以直接在该 Json 文件中更新即可,不需要重启 Prometheus 服务。
五、配置Alertmanager
1、docker启动Alertmanager
docker run --name alertmanager -d -p 9093:9093 prom/alertmanager
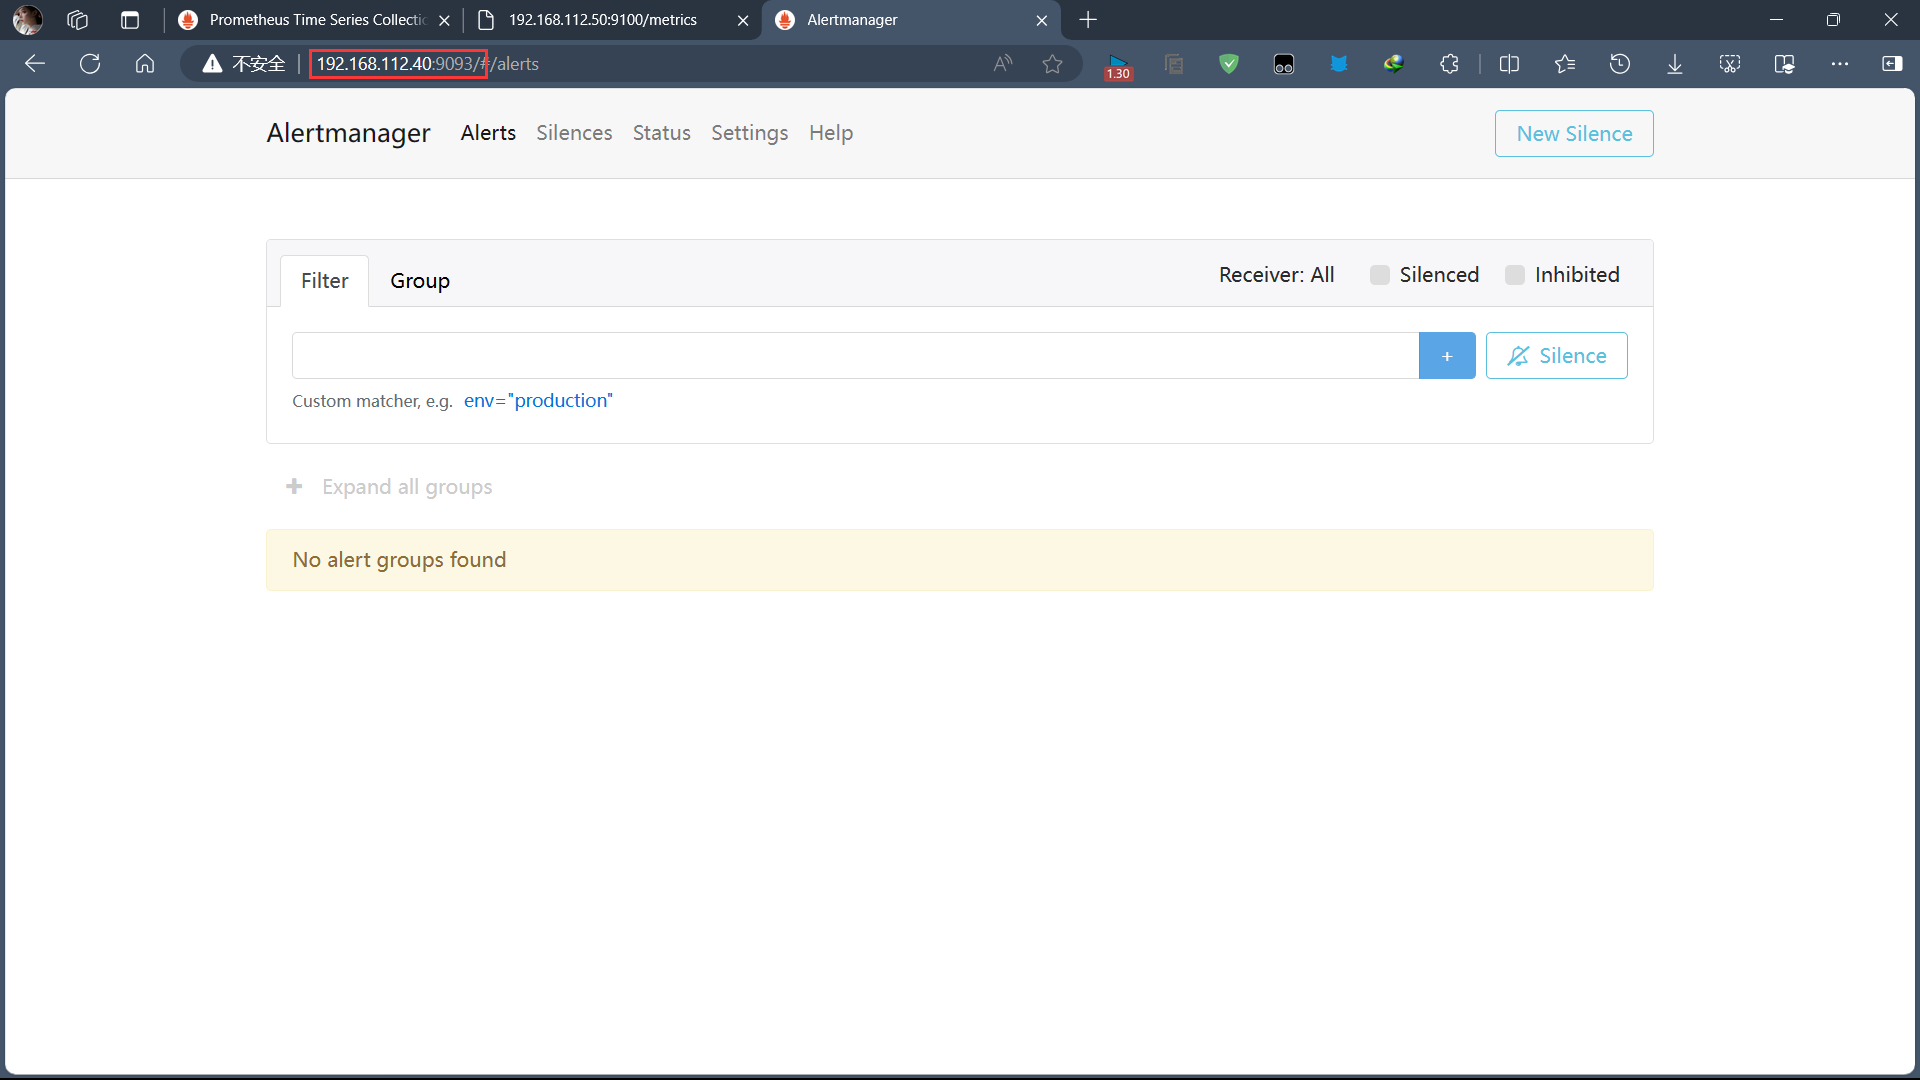
AlertManager 的默认启动端口为 9093,启动完成后,浏览器访问 192.168.112.40:9093 可以看到默认提供的 UI 页面,不过现在是没有任何告警信息的,因为我们还没有配置报警规则来触发报警。
六、Alertmanager配置邮件告警
AlertManager 默认配置文件为 alertmanager.yml,在容器内路径为 /etc/alertmanager/alertmanager.yml,默认配置如下:
route:
  group_by: ['alertname']
  group_wait: 30s
  group_interval: 5m
  repeat_interval: 1h
  receiver: 'web.hook'
receivers:
  - name: 'web.hook'
    webhook_configs:
      - url: 'http://127.0.0.1:5001/'
inhibit_rules:
  - source_match:
      severity: 'critical'
    target_match:
      severity: 'warning'
    equal: ['alertname', 'dev', 'instance']
-
route: 用来设置报警的分发策略,它是一个树状结构,按照深度优先从左向右的顺序进行匹配。
-
receivers: 配置告警消息接受者信息,例如常用的 email、wechat、slack、webhook 等消息通知方式。
-
inhibit_rules: 抑制规则配置,当存在与另一组匹配的警报(源)时,抑制规则将禁用与一组匹配的警报(目标)。
以QQ邮箱为例:
global:
  resolve_timeout: 5m
  smtp_from: '2830909671@qq.com'
  smtp_smarthost: 'smtp.qq.com:465'
  smtp_auth_username: '2830909671@qq.com'
  smtp_auth_password: 'asdjkbmlggxiddfc'
  smtp_require_tls: false
  smtp_hello: 'qq.com'
route:
  group_by: ['alertname']
  group_wait: 5s
  group_interval: 5s
  repeat_interval: 5m
  receiver: 'email'
receivers:
- name: 'email'
  email_configs:
  - to: 'misakikk@qq.com'
    send_resolved: true
inhibit_rules:
  - source_match:
      severity: 'critical'
    target_match:
      severity: 'warning'
    equal: ['alertname', 'dev', 'instance']
smtp_smarthost: 这里为 QQ 邮箱 SMTP 服务地址,官方地址为 smtp.qq.com 端口为 465 或 587,同时要设置开启 POP3/SMTP 服务。
smtp_auth_password: 这里为第三方登录 QQ 邮箱的授权码,非 QQ 账户登录密码,否则会报错,获取方式在 QQ 邮箱服务端设置开启 POP3/SMTP 服务时会提示。
smtp_require_tls: 是否使用 tls,根据环境不同,来选择开启和关闭。如果提示报错 email.loginAuth failed: 530 Must issue a STARTTLS command first,那么就需要设置为 true。
着重说明一下,如果开启了 tls,提示报错 starttls failed: x509: certificate signed by unknown authority,需要在 email_configs 下配置 insecure_skip_verify: true 来跳过 tls 验证。
修改 AlertManager 启动命令,将本地 alertmanager.yml 文件挂载到容器内指定位置。
docker run -d --name alertmanager -p 9093:9093 -v /root/prometheus/alertmanager.yml:/etc/alertmanager/alertmanager.yml prom/alertmanager
七、配置Alertmanager告警规则
1、创建报警规则文件node-up.rules
groups:
- name: node-up
  rules:
  - alert: node-up
    expr: up{job="node-exporter"} == 0
    for: 15s
    labels:
      severity: 1
      team: node
    annotations:
      summary: "{{ $labels.instance }} 已停止运行超过 15s!"
该 rules 目的是监测 node 是否存活,expr 为 PromQL 表达式验证特定节点 job=“node-exporter” 是否活着;
for 表示报警状态为 Pending 后等待 15s 变成 Firing 状态,一旦变成 Firing 状态则将报警发送到 AlertManager;
labels 和 annotations 对该 alert 添加更多的标识说明信息,所有添加的标签注解信息,以及 prometheus.yml 中该 job 已添加 label 都会自动添加到邮件内容中。
2、然后修改 prometheus.yml 配置文件,添加 rules 规则文件。
...
# Alertmanager configuration
alerting:
  alertmanagers:
  - static_configs:
    - targets:
      - 192.168.112.40:9093

rule_files:
  - "/usr/local/prometheus/rules/*.rules"
...
注意: 这里
rule_files为容器内路径,需要将本地node-up.rules文件挂载到容器内指定路径,修改 Prometheus 启动命令如下,并重启服务。
docker run --name prometheus -d -p 9090:9090 -v /root/prometheus/prometheus.yml:/etc/prometheus/prometheus.yml -v /root/prometheus/groups/:/usr/local/prometheus/groups/ -v /root/prometheus/rules/:/usr/local/prometheus/rules/ prom/prometheus
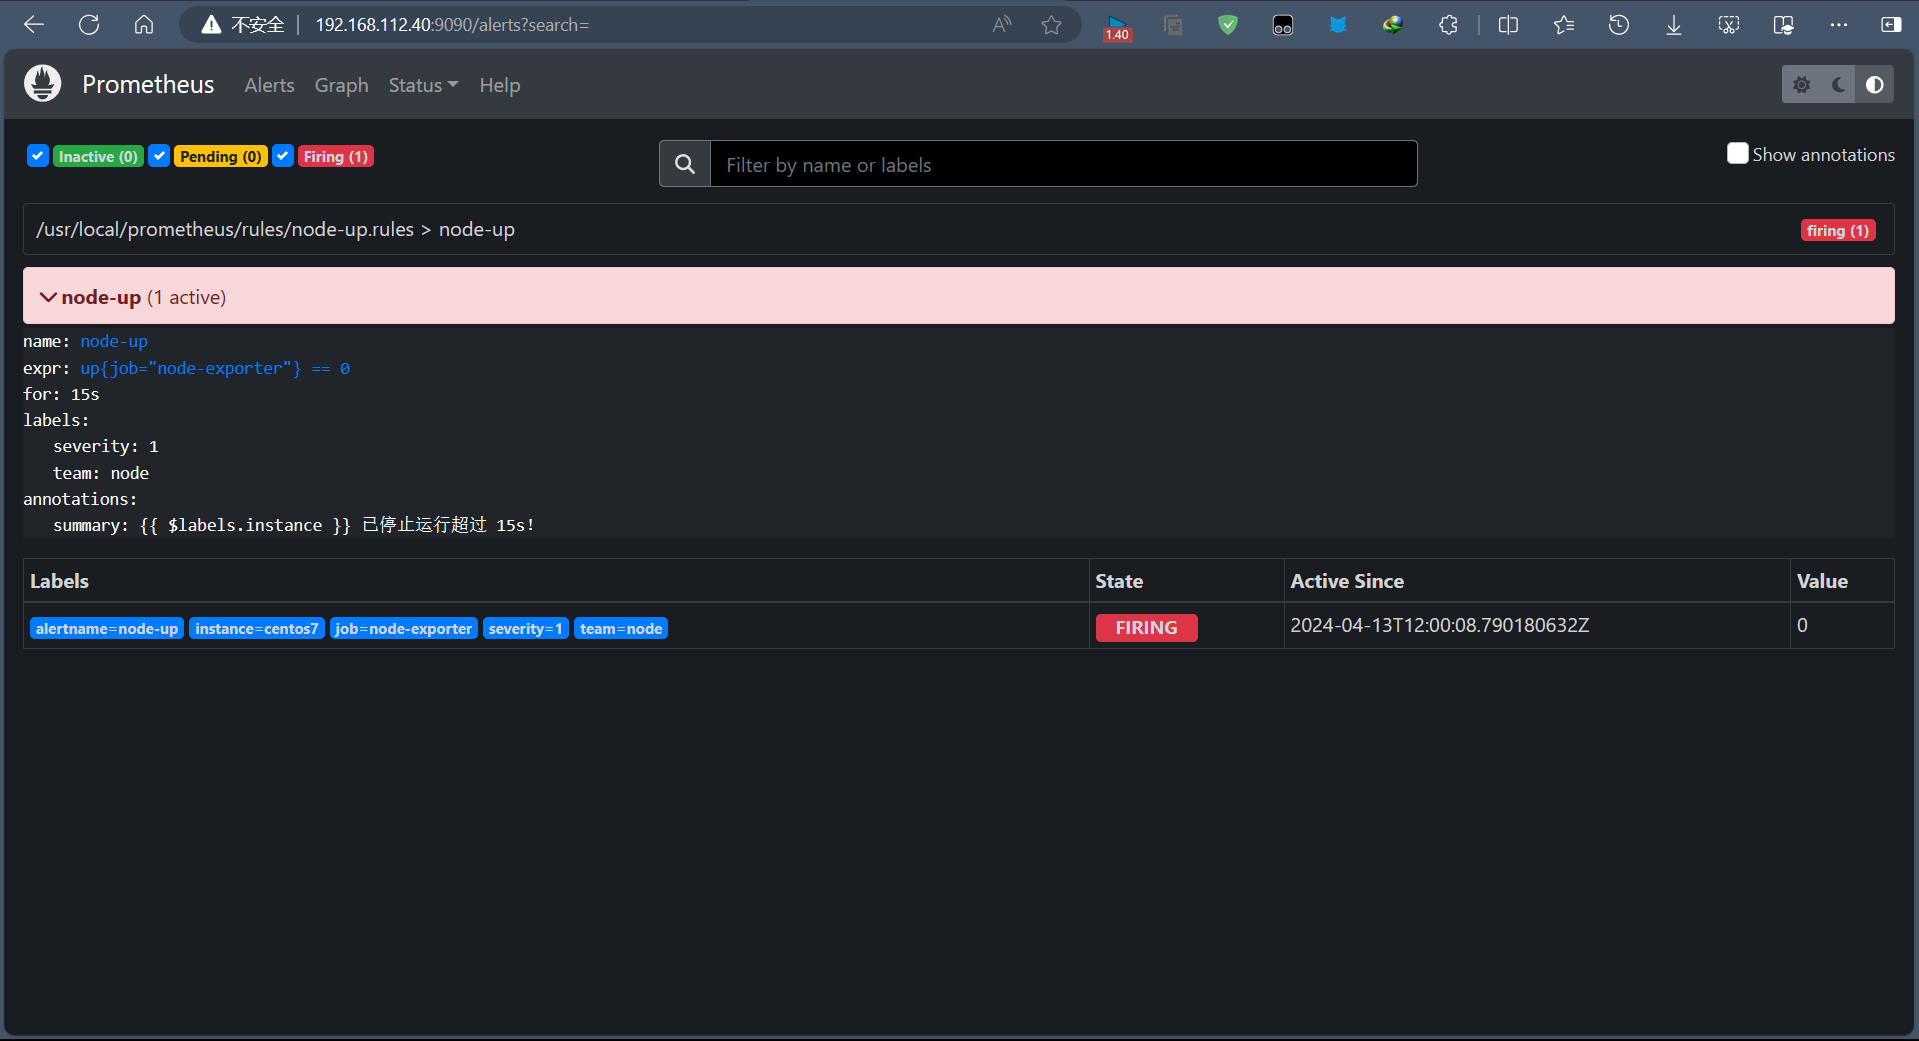
浏览器输入192.168.112.40:9090/rules
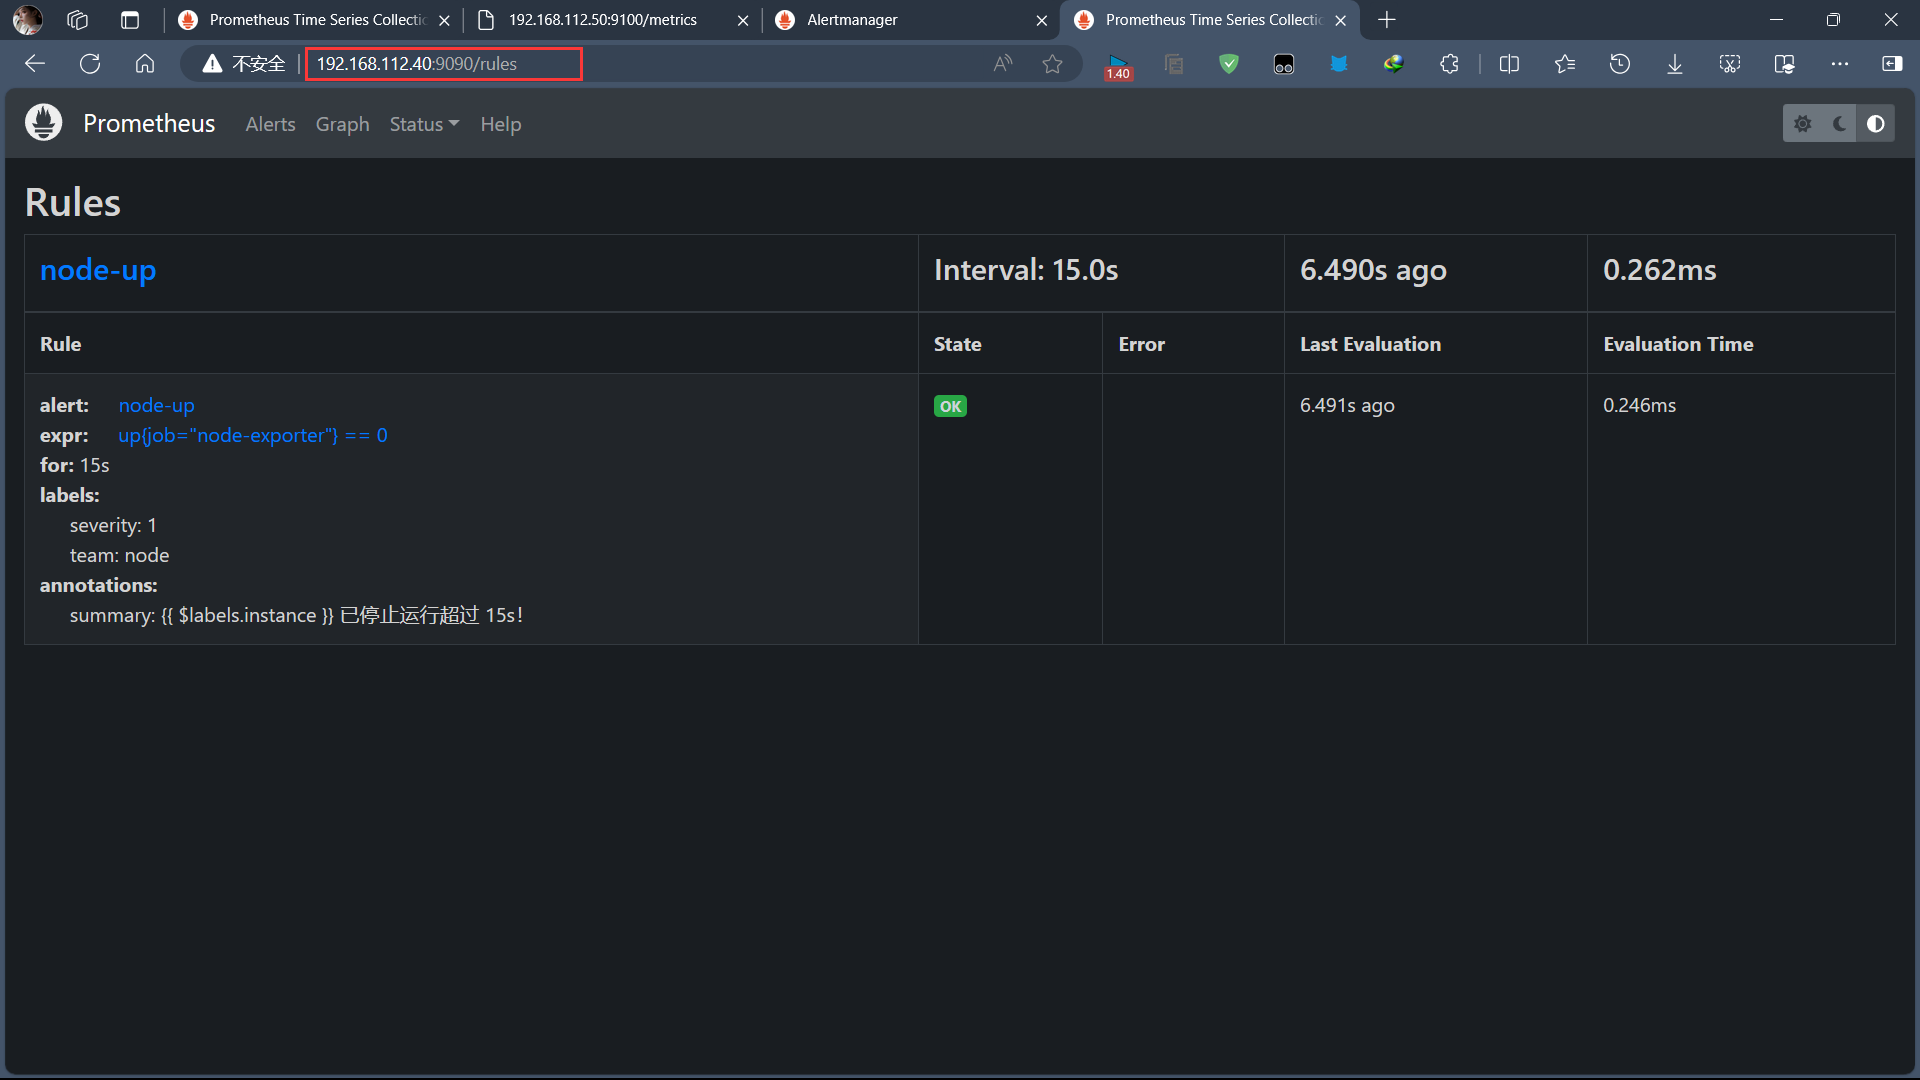
Prometheus Alert 告警状态有三种状态:Inactive、Pending、Firing。
Inactive:非活动状态,表示正在监控,但是还未有任何警报触发。
Pending:表示这个警报必须被触发。由于警报可以被分组、压抑/抑制或静默/静音,所以等待验证,一旦所有的验证都通过,则将转到 Firing 状态。
Firing:将警报发送到 AlertManager,它将按照配置将警报的发送给所有接收者。一旦警报解除,则将状态转到 Inactive,如此循环。
八、触发报警发送Email
1、停止服务测试
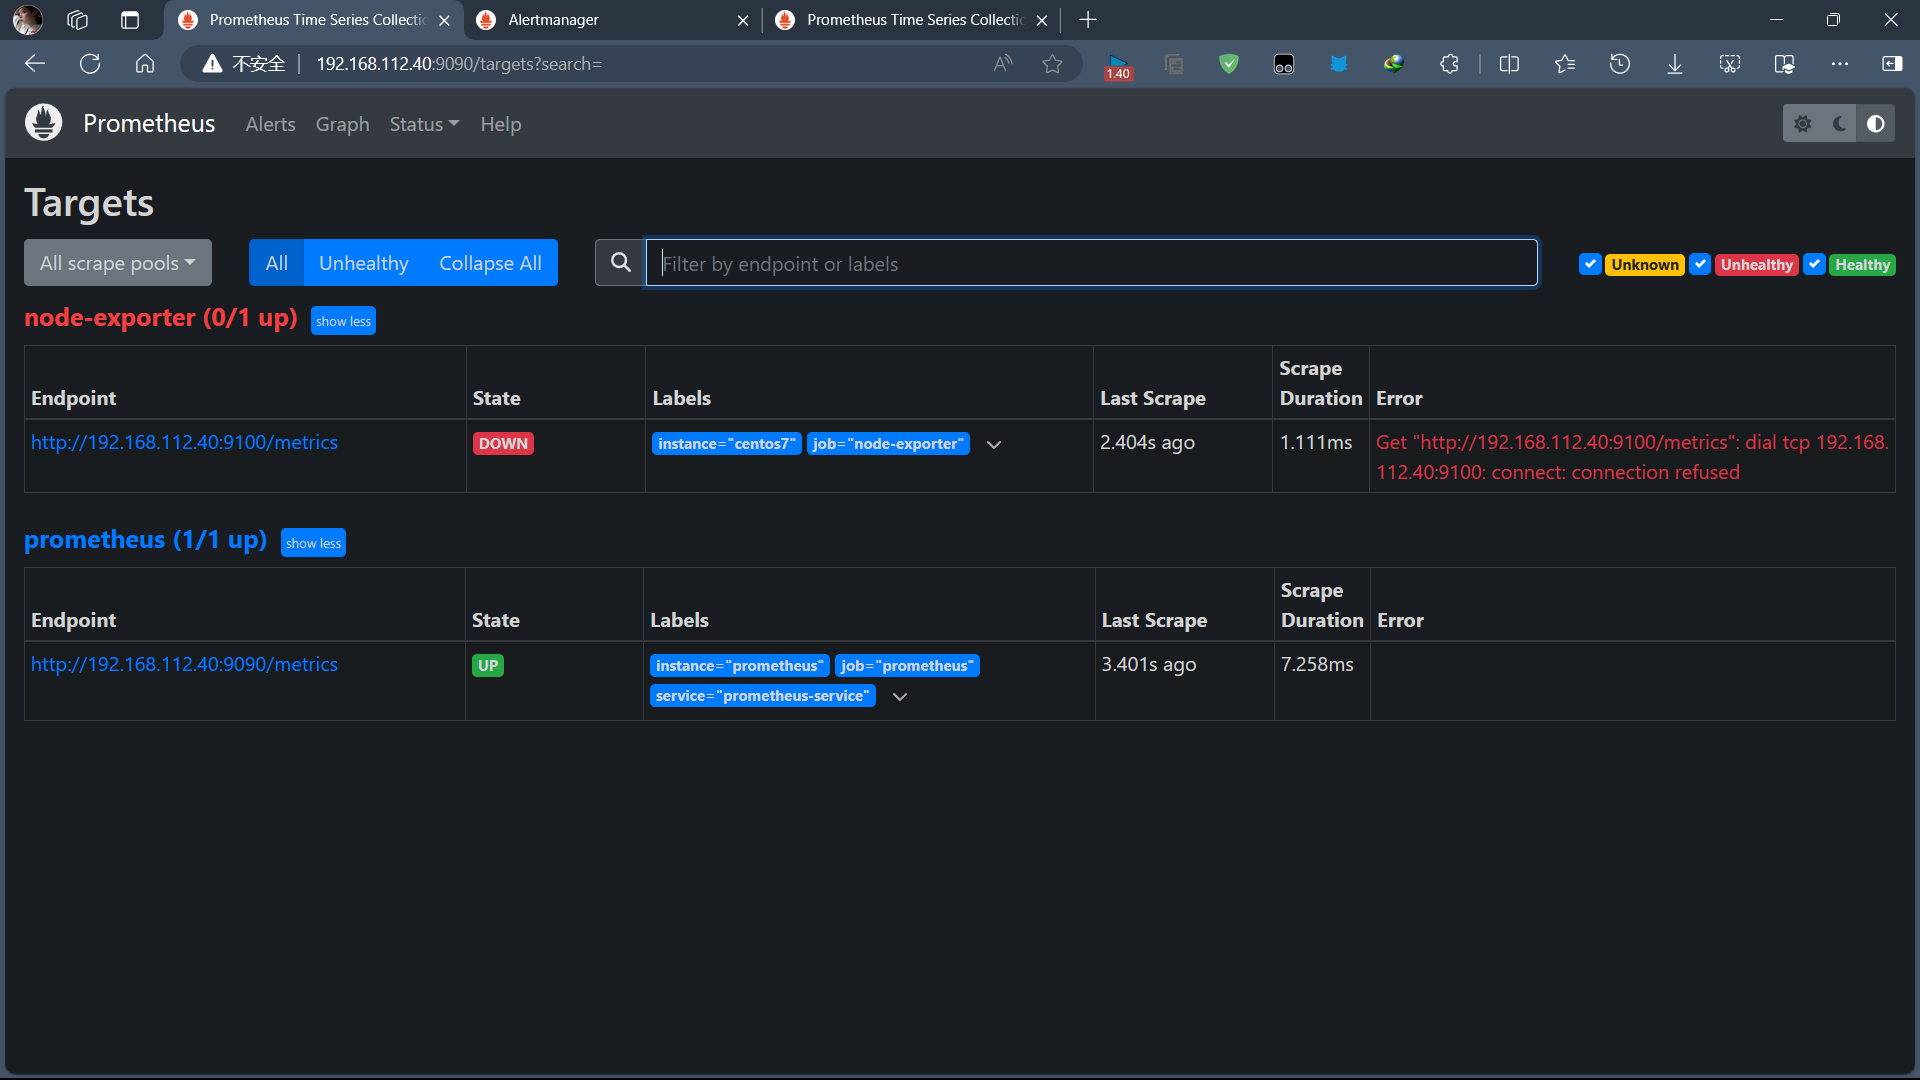
上边我们定义的 rule 规则为监测 job=“node-exporter” Node 是否活着,那么就可以停掉 node-exporter 服务来间接起到 Node Down 的作用,从而达到报警条件,触发报警规则。
在被监控主机:192.168.112.50(node-exporter)上操作
docker stop node-exporter
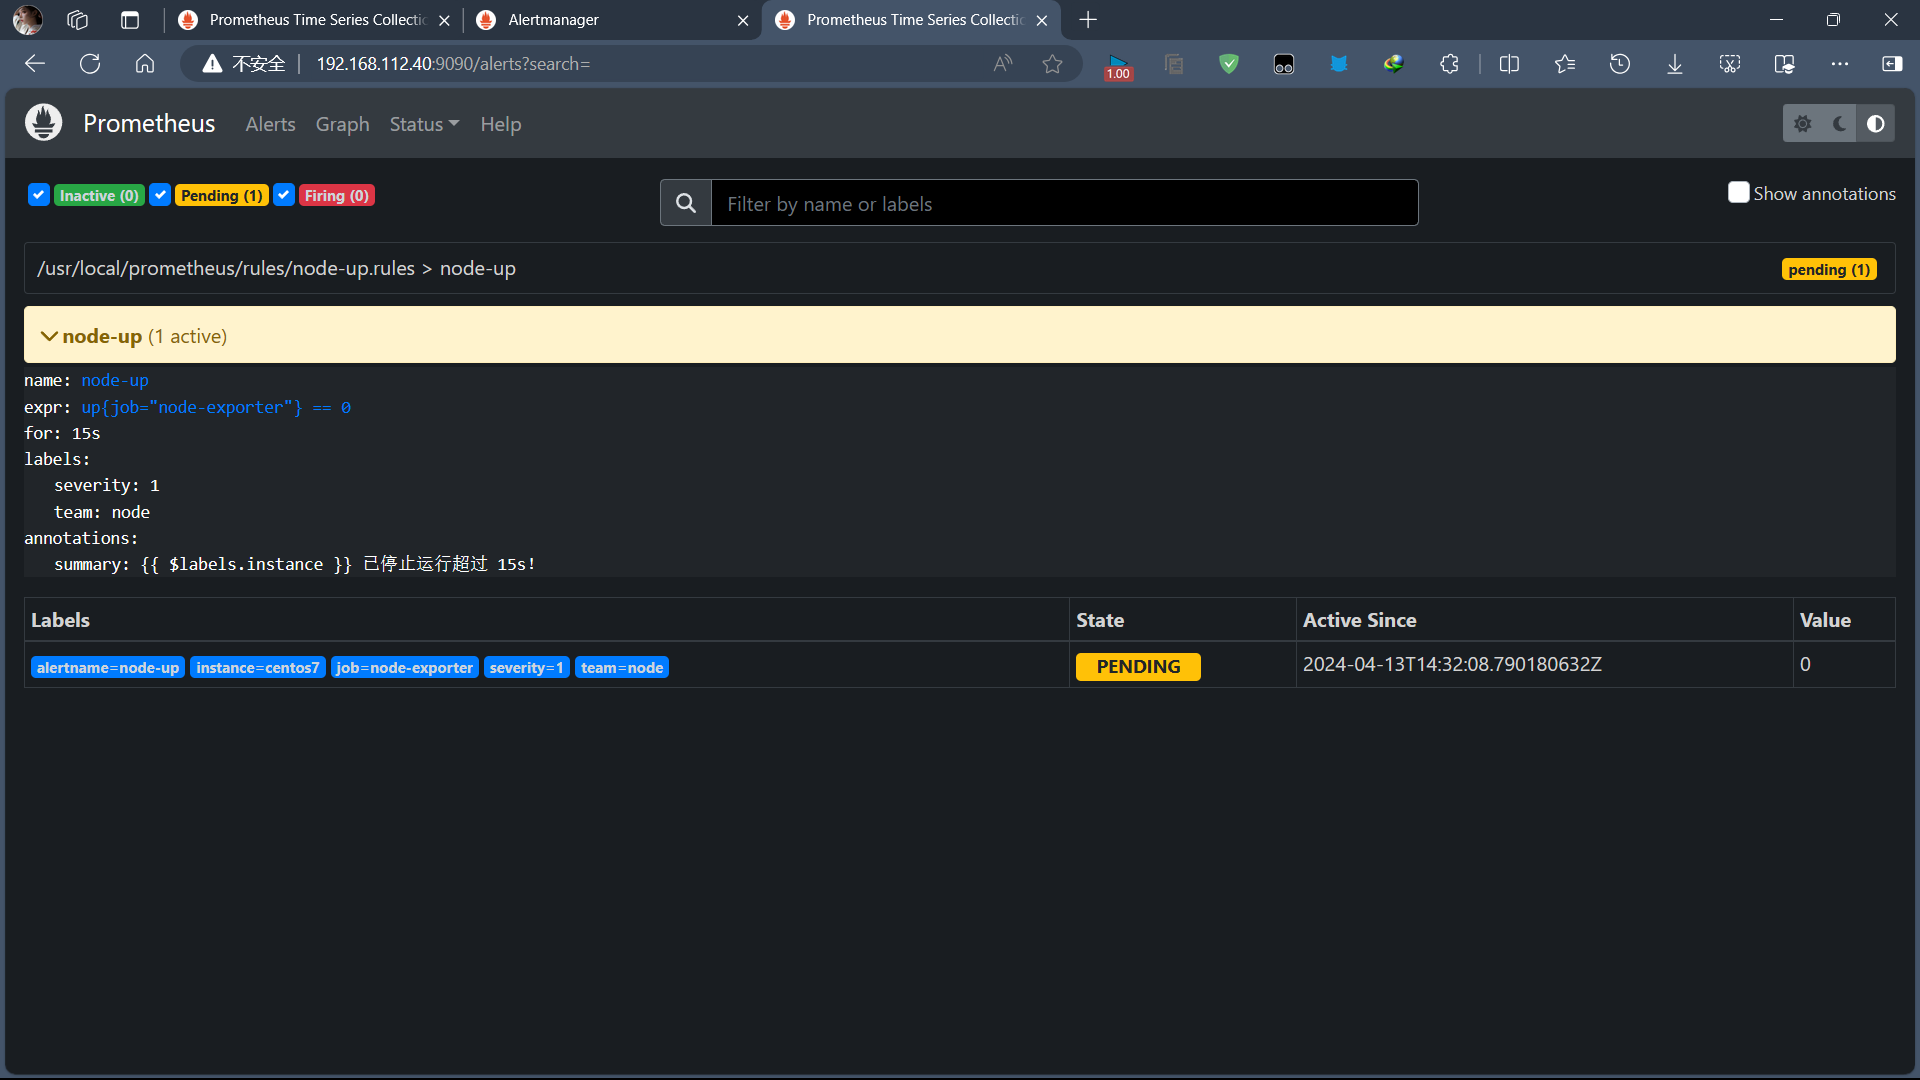
停止服务后,等待 15s 之后可以看到 Prometheus target 里面 node-exproter 状态为 unhealthy 状态,等待 15s 后,alert 页面由绿色 node-up (0 active) Inactive 状态变成了黄色 node-up (1 active) Pending 状态,继续等待 15s 后状态变成红色 Firing 状态,向 AlertManager 发送报警信息,此时 AlertManager 则按照配置规则向接受者发送邮件告警。
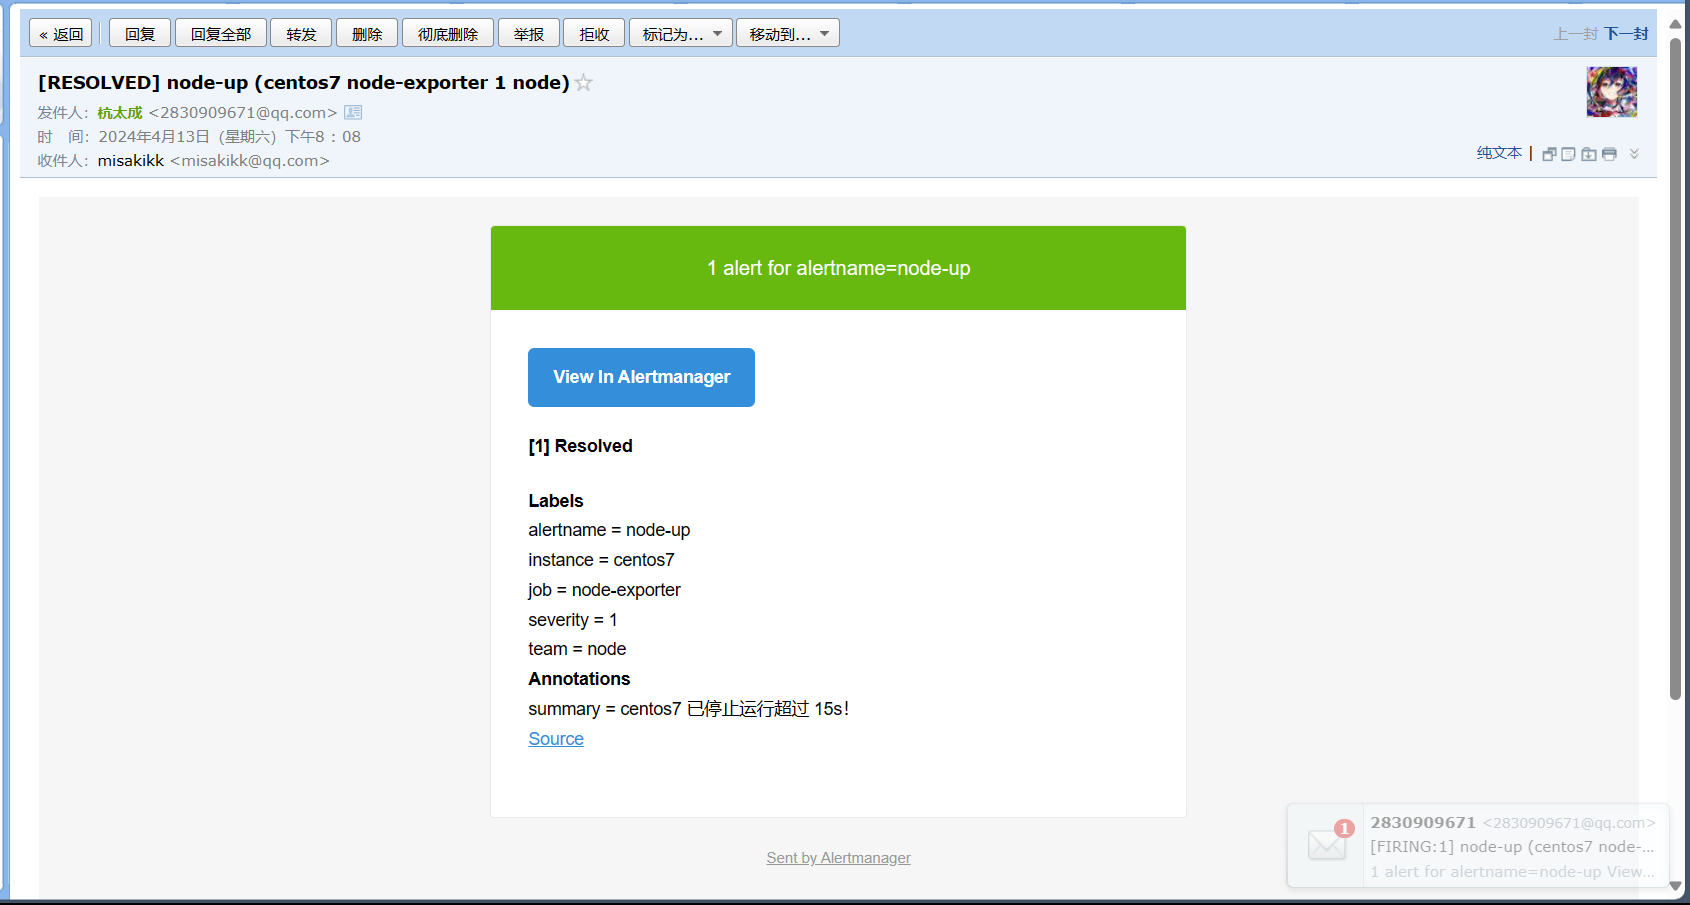
默认的邮件信息:
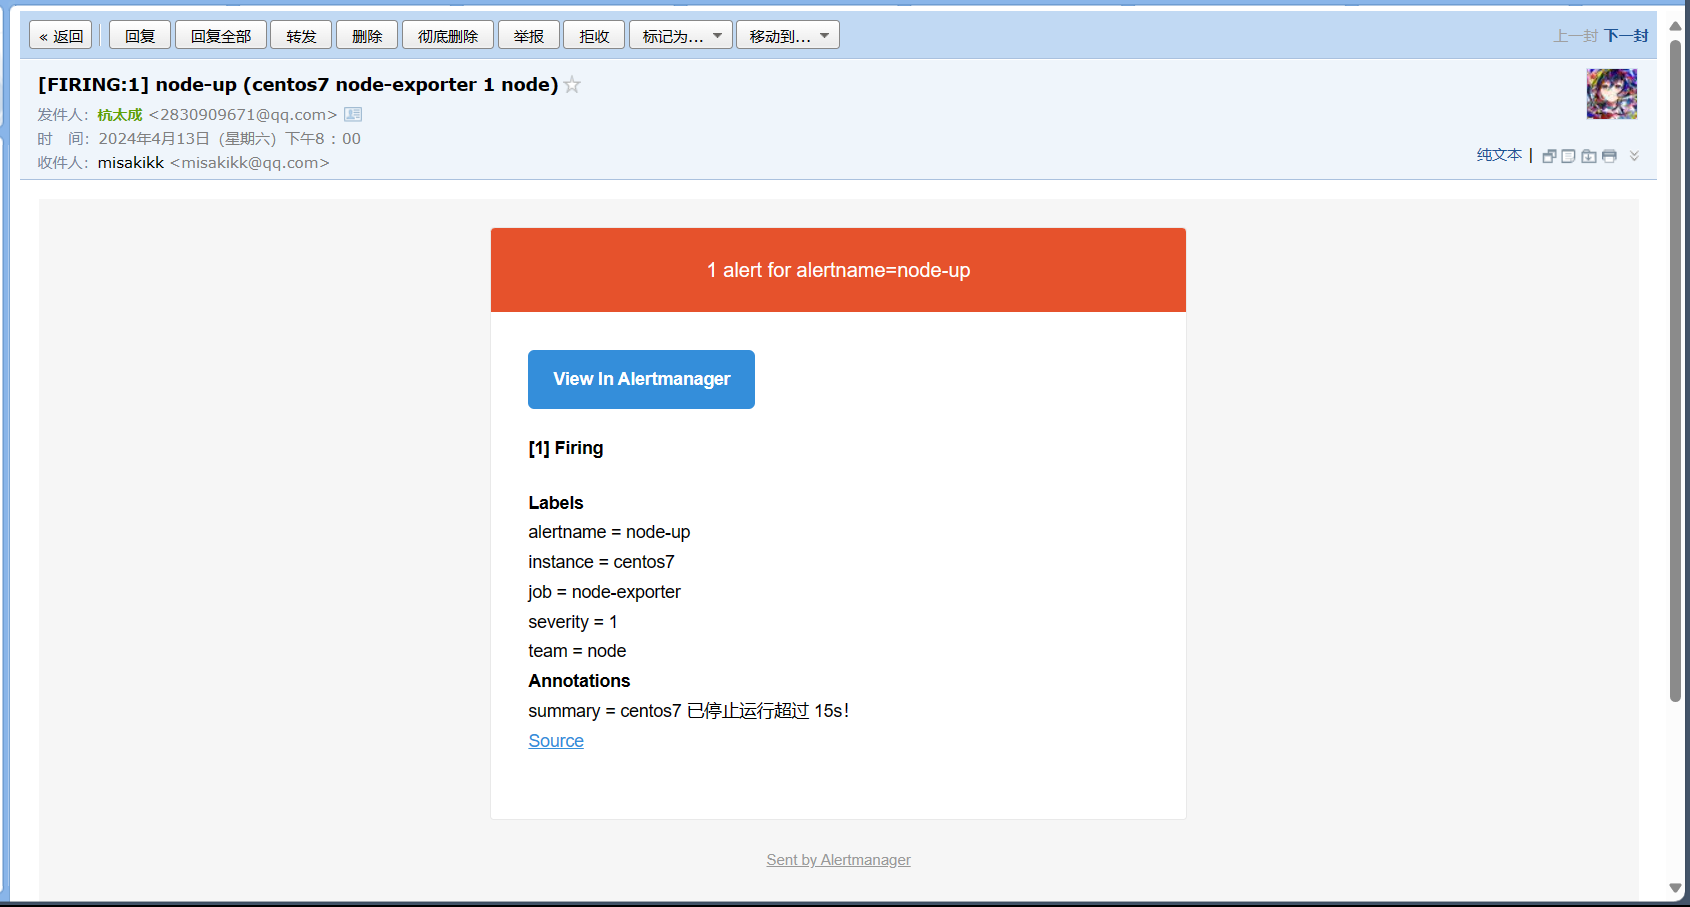
从上图可以看到,默认邮件模板 Title 及 Body 会将之前配置的 Labels 及 Annotations 信息均包含在内,而且每隔 5m 会自动发送,直到服务恢复正常,报警解除为止,同时会发送一封报警解除邮件。接下来,我们启动 node-exporter 来恢复服务。
docker start node-exporter
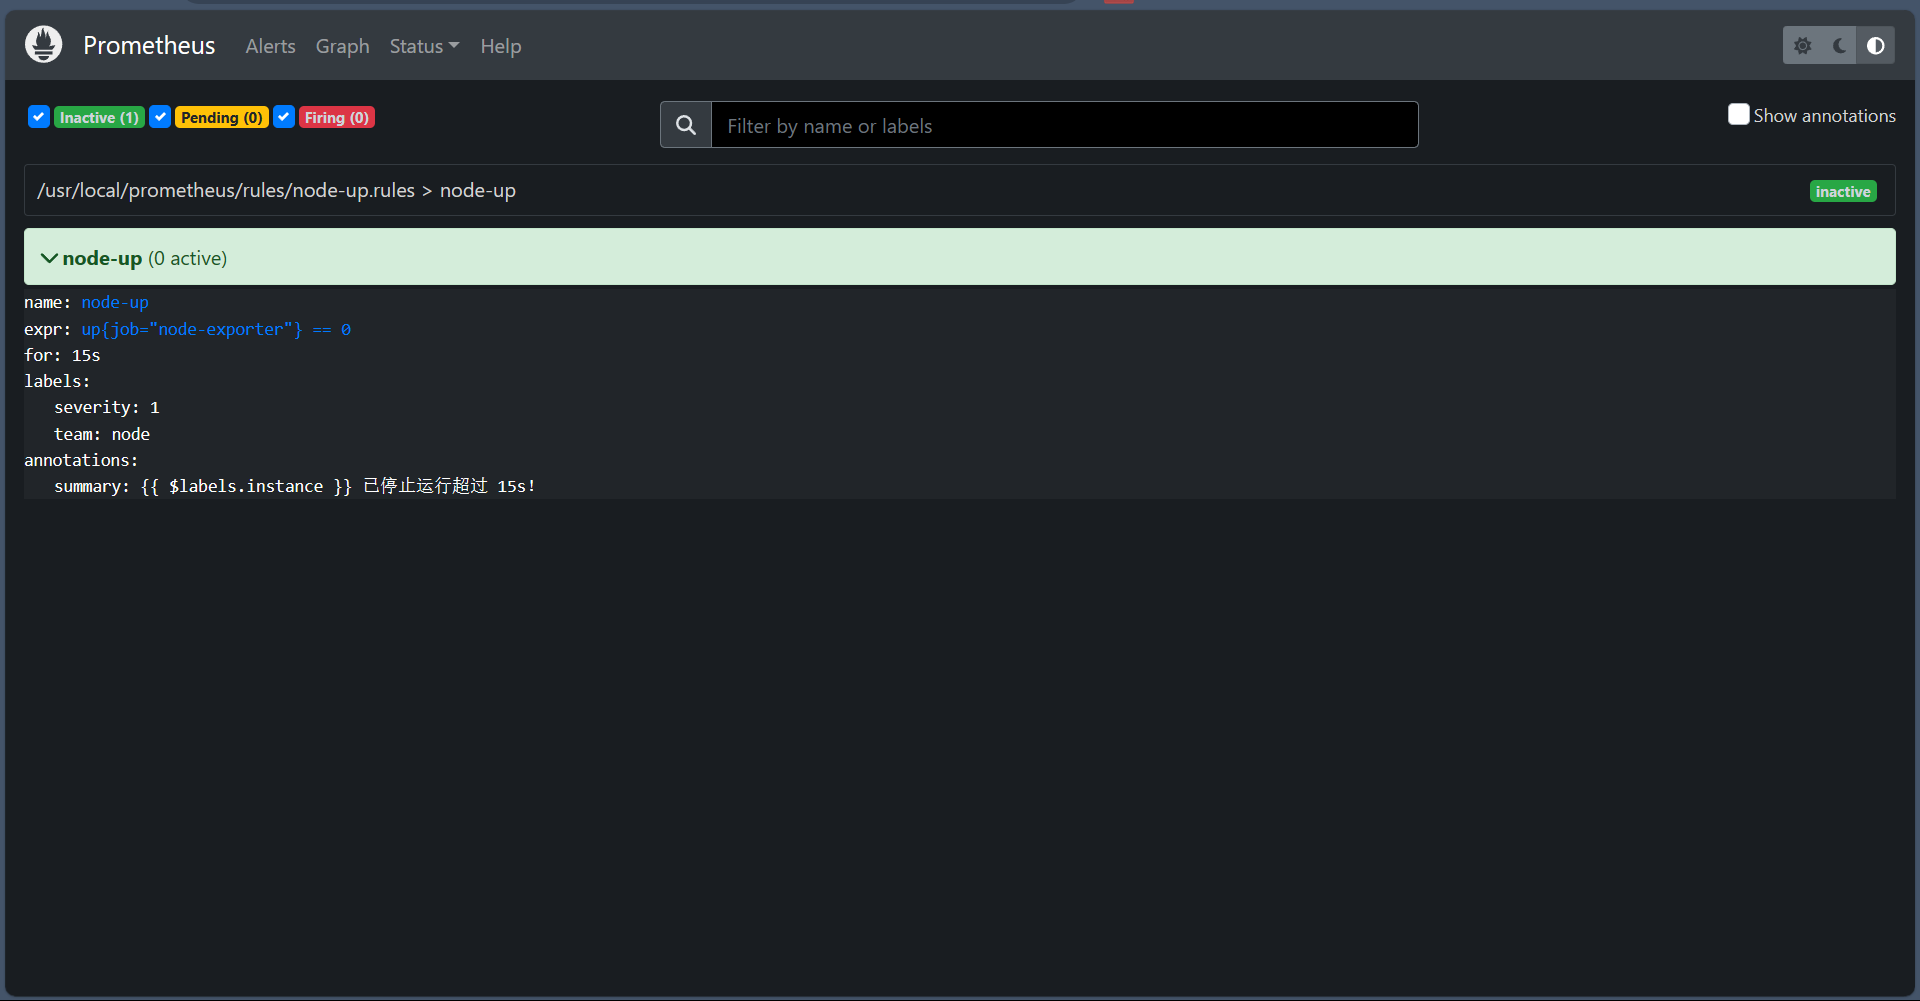
等待 15s 之后,Prometheus Alerts 页面变成绿色 node-up (0 active) Inactive 状态,同时也收到了报警解除邮件提醒
九、Alertmanager配置自定义邮件模板
1、创建一个模板文件
邮件格式内容可以更优雅直观一些,那么,AlertManager 也是支持自定义邮件模板配置的,首先新建一个模板文件 email.tmpl。
{{ define "email.from" }}2830909671@qq.com{{ end }}
{{ define "email.to" }}misakikk@qq.com{{ end }}
{{ define "email.to.html" }}
{{ range .Alerts }}
=========start==========<br>
告警程序: prometheus_alert <br>
告警级别: {{ .Labels.severity }} 级 <br>
告警类型: {{ .Labels.alertname }} <br>
故障主机: {{ .Labels.instance }} <br>
告警主题: {{ .Annotations.summary }} <br>
告警详情: {{ .Annotations.description }} <br>
触发时间: {{ .StartsAt.Format "2024-04-13 22:30:00" }} <br>
=========end==========<br>
{{ end }}
{{ end }}
简单说明一下,上边模板文件配置了 email.from、email.to、email.to.html 三种模板变量,可以在 alertmanager.yml 文件中直接配置引用。这里 email.to.html 就是要发送的邮件内容,支持 Html 和 Text 格式,这里为了显示好看,采用 Html 格式简单显示信息。下边 {{ range .Alerts }} 是个循环语法,用于循环获取匹配的 Alerts 的信息,下边的告警信息跟上边默认邮件显示信息一样,只是提取了部分核心值来展示。然后,需要增加 alertmanager.yml 文件 templates 配置如下:
global:
  resolve_timeout: 5m
  smtp_from: '{{ template "email.from" . }}'
  smtp_smarthost: 'smtp.qq.com:465'
  smtp_auth_username: '{{ template "email.from" . }}'
  smtp_auth_password: 'asdjkbmlggxiddfc'
  smtp_require_tls: false
  smtp_hello: 'qq.com'
templates:
  - '/etc/alertmanager-tmpl/email.tmpl'
route:
  group_by: ['alertname']
  group_wait: 5s
  group_interval: 5s
  repeat_interval: 5m
  receiver: 'email'
receivers:
- name: 'email'
  email_configs:
  - to: '{{ template "email.to" . }}'
    html: '{{ template "email.to.html" . }}'
    send_resolved: true
inhibit_rules:
  - source_match:
      severity: 'critical'
    target_match:
      severity: 'warning'
    equal: ['alertname', 'dev', 'instance']
然后,修改 AlertManager 启动命令,将本地 email.tmpl 文件挂载到容器内指定位置并重启。
docker run -d --name alertmanager -p 9093:9093 -v /root/prometheus/alertmanager.yml:/etc/alertmanager/alertmanager.yml -v /root/prometheus/alertmanager-tmpl/:/etc/alertmanager-tmpl/ prom/alertmanager:latest
上边模板中由于配置了 {{ .Annotations.description }} 变量,而之前 node-up.rules 中并没有配置该变量,会导致获取不到值,所以这里我们修改一下 node-up.rules 并重启 Promethues 服务。
vim /root/prometheus/rules/node-up.rules

groups:
- name: node-up
  rules:
  - alert: node-up
    expr: up{job="node-exporter"} == 0
    for: 15s
    labels:
      severity: 1
      team: node
    annotations:
      summary: "{{ $labels.instance }} 已停止运行!"
      description: "{{ $labels.instance }} 检测到异常停止!请重点关注!!!"
重启完毕后,同样模拟触发报警条件(停止 node-exporter 服务),也是可以正常发送模板邮件出来的。